
JIEYAO LIGHTING · ORIGINAL BUYER ANALYSIS
Eight published winter sun-hour examples reveal why daily balance and post-cloud recovery need separate panel-sizing calculations.
Size the solar panel against battery-side nightly energy, design solar resource and charging losses, then add the agreed reserve-recovery target. In this example, an 80W panel needs 4 peak sun hours to replace 240Wh with a 0.75 storage factor.

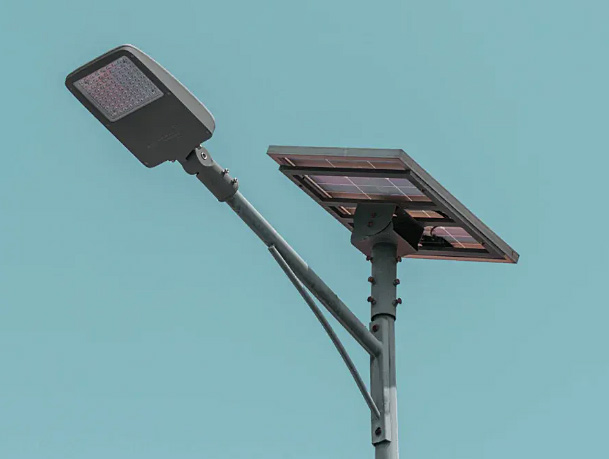
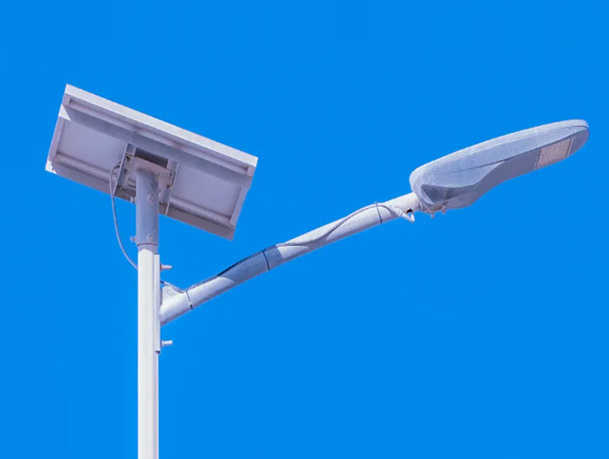
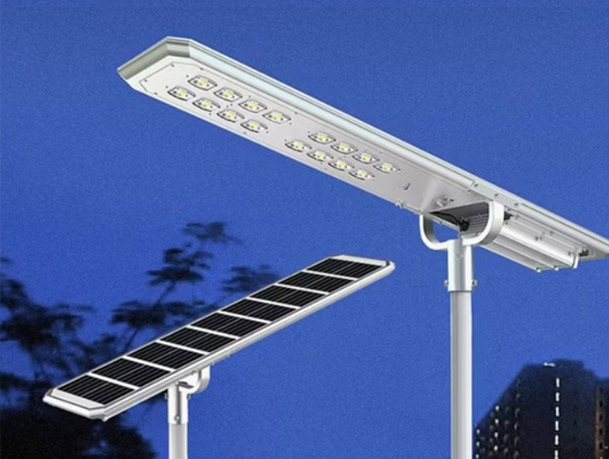
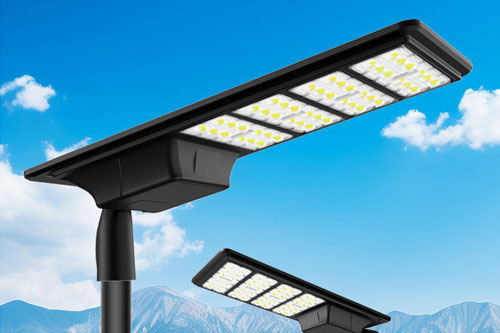
Product/application photograph from the supplied image library. No model rating or test result is assigned to the pictured item.
An 80W solar panel label does not tell a buyer whether a street light will recover its energy every day. The answer also depends on the solar resource, mounting and losses, alongside the actual night schedule. We used eight published winter examples to isolate how strongly the solar-resource input changes the screen.
With an assumed 240Wh nightly battery-side load and a 0.75 PV-to-storage factor, an 80W panel falls below daily balance in seven of these eight examples. This is an arithmetic finding for this selected dataset—not a failure rate for real installations or proof that all 80W systems are undersized.
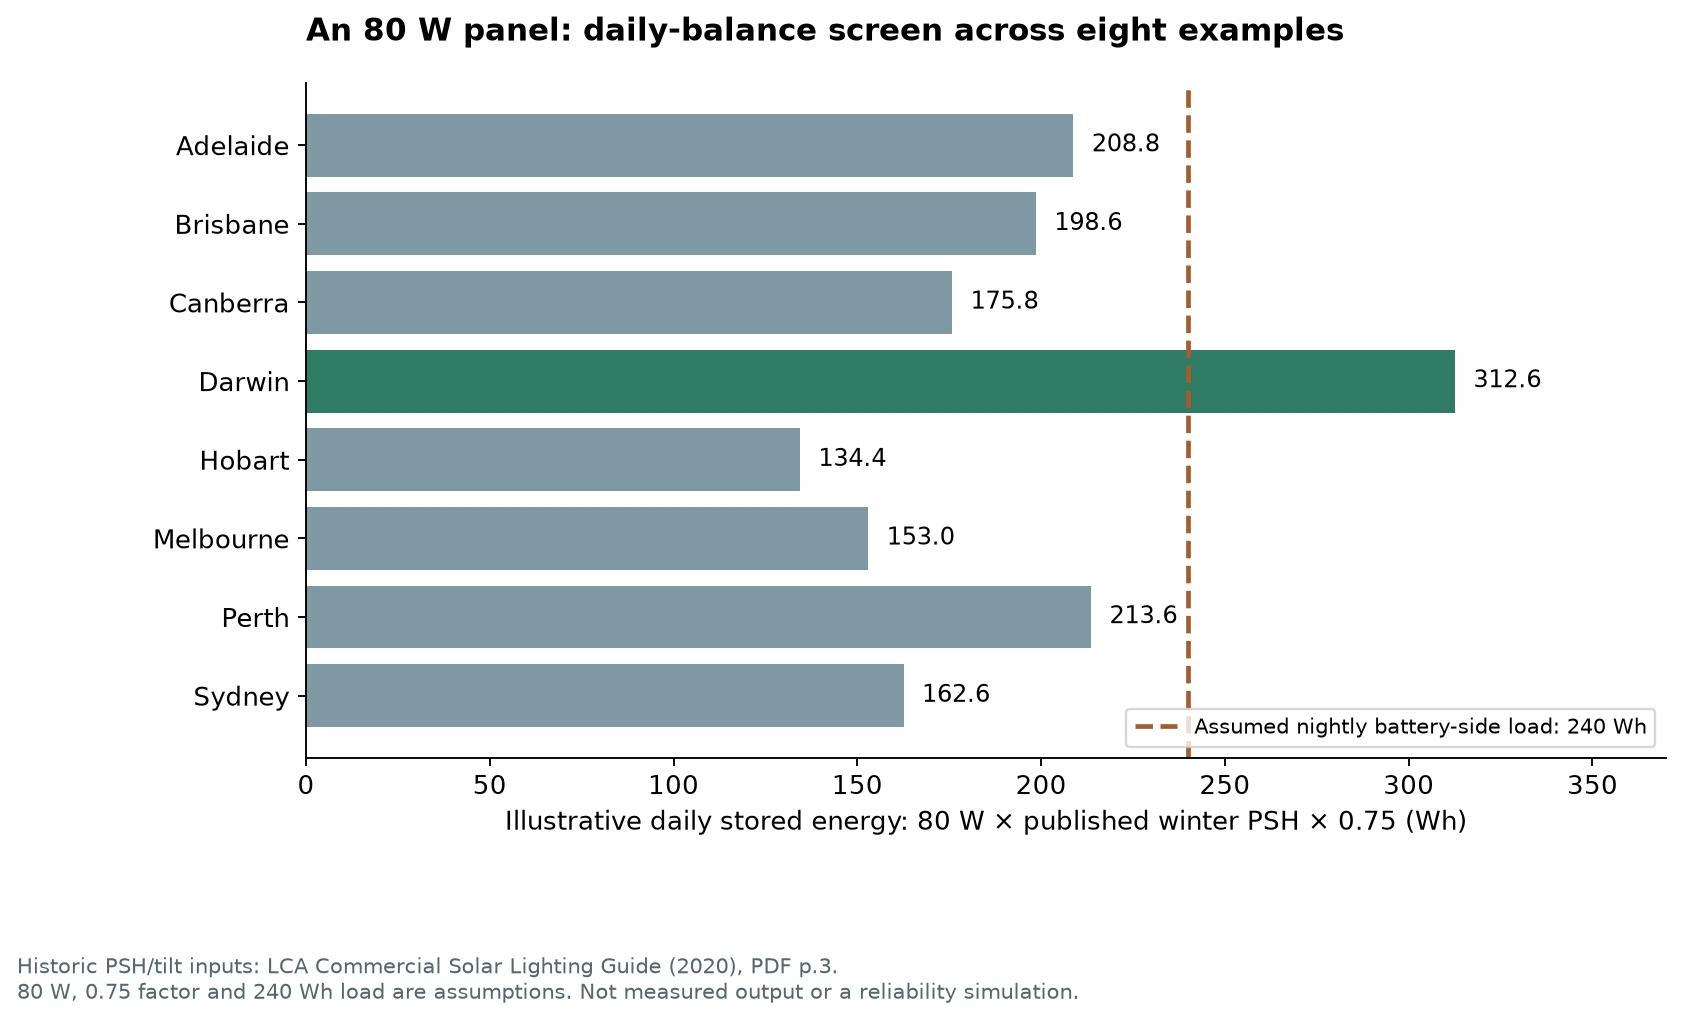
Our calculations combine historic LCA example inputs with disclosed assumptions. No installed panel output was measured.
Lighting Council Australia’s 2020 Commercial Solar Lighting Guide, PDF page 3, prints winter peak-sun-hour examples and associated panel tilts for eight cities. We checked the original table visually and transcribed those winter values. Its footnote attributes the underlying data to NASA SSE/POWER; these are historical illustrative inputs, not newly retrieved 2026 weather data.
| Example location | Published winter tilt | Published winter PSH | 80W × PSH × 0.75 |
|---|---|---|---|
| Adelaide | 51° | 3.48 | 208.8 Wh/day |
| Brisbane | 42° | 3.31 | 198.6 Wh/day |
| Canberra | 56° | 2.93 | 175.8 Wh/day |
| Darwin | 50° | 5.21 | 312.6 Wh/day |
| Hobart | 63° | 2.24 | 134.4 Wh/day |
| Melbourne | 55° | 2.55 | 153.0 Wh/day |
| Perth | 47° | 3.56 | 213.6 Wh/day |
| Sydney | 34° | 2.71 | 162.6 Wh/day |
PSH represents irradiation expressed as equivalent hours at 1,000W/m², rather than the number of hours between sunrise and sunset. The source associates the examples with different tilts. We do not treat its summer and winter columns as measurements of one unchanged fixed installation.
Keep the limits of the dataset beside the finding: eight named examples are not a random sample of markets, and a published seasonal example is not a sequence of consecutive cloudy days. A project needs a current, agreed dataset for its own coordinates, orientation and mounting constraints.
Set the load boundary first. Here, 240Wh is an assumed total withdrawal from the battery over one night, including downstream losses and auxiliary loads. It could represent measured 30W battery input for four hours plus 15W for eight hours. It is not a claim that dimming a particular model by half necessarily halves its battery input.
| Input | Value | Status |
|---|---|---|
| Nightly battery-side withdrawal L | 240 Wh | Assumed, held constant |
| PV-to-stored-energy factor f | 0.75 | Assumed; excludes night discharge losses already inside L |
| Panel rating P | 80 W | Example rating |
| Design solar input H | 2.24–5.21 PSH | Historic published winter examples |
| Storage/controller conditions | Headroom and compatible operating limits | Assumed for this first screen |
Daily stored energy = P × H × f. Daily balance requires this to cover L. The corresponding panel screen is P = L ÷ (H × f). At 2.24 PSH, 240 ÷ (2.24 × 0.75) = 142.86W. At 5.21 PSH it is 61.42W. These are mathematical thresholds before selecting a real module and adding any further agreed margins.
Do not silently replace 0.75 with a general industry guarantee. Temperature, wiring, soiling, controller behavior and battery charging change the actual factor. A controller’s peak efficiency alone is not the entire PV-to-stored-energy factor. When losses are modelled separately, reconcile them with this aggregate factor so they are not added twice.
A panel that only replaces one normal night’s withdrawal has no modeled surplus to refill a depleted reserve. This matters after cloudy weather: the light still consumes energy during the recovery nights. Battery capacity and panel recovery should therefore be reviewed as separate requirements.
For a second explicit scenario, assume three nights with zero charging withdraw 3 × 240 = 720Wh from storage. The battery is assumed large enough to supply this without crossing its permitted lower limit. To restore those 720Wh over three subsequent charging days while also supplying 240Wh for each following night, the mean storage target becomes 240 + 720 ÷ 3 = 480Wh/day.
| PSH example | Daily balance: 240Wh/day | Three-day recovery: 480Wh/day |
|---|---|---|
| 2.24 | 142.9 W | 285.7 W |
| 3.48 | 92.0 W | 183.9 W |
| 5.21 | 61.4 W | 122.8 W |
In this fixed scenario the recovery threshold is twice the daily-balance threshold. That is a consequence of the chosen reserve deficit and recovery period, not a universal requirement to double every panel. One recovery day would demand a different result; partial charging during the cloudy period would reduce the deficit.
Required mean panel power = [nightly withdrawal + reserve deficit ÷ recovery days] ÷ [design PSH × PV-to-storage factor]. State when the deficit is measured and whether intervening nights are included.
A positive average balance can coexist with an empty battery during a poor sequence of days. Conversely, a battery may be full when potential solar energy is available, so that energy cannot all be captured. Charging current limits, low-temperature inhibition, shading and the programmed load can further change the sequence.
The European Commission’s PVGIS off-grid method follows consumption, generation and battery energy over a weather time series and reports unmet demand and battery-state outcomes. That is a different level of analysis from our eight-input comparison. No PVGIS simulation or loss-of-load probability was calculated for this article.
Before approving a configuration, request the agreed solar database and years, orientation/tilt, hourly duty, usable storage, charge/discharge limits and a time-series result with stated unmet-load criteria. Panel wind loading, brackets and pole/foundation suitability also need their own design check; an energy result does not approve a mechanical installation.
Yangzhou Jieyao Lighting Equipment Co., Ltd. supplies outdoor lighting from Yangzhou, China. For a split-type solar street light enquiry, provide coordinates, road-lighting targets, nightly operation, required backup, recovery target and mounting restrictions. Ask which assumptions and evidence apply to the offered assembly.
Use the general battery and panel calculation guide for the full workflow. Read the three-night reserve example alongside the recovery requirement, and the winter charge-permission analysis where low cell temperatures matter.
Provide daily balance and post-cloud recovery calculations separately. State the weather/solar-data basis, panel orientation, measured battery-side duty, PV-to-storage losses, usable storage and temperature/current limits. Show the result for the agreed critical season and recovery period.
The labels alone cannot answer it. Under this article’s 240Wh nightly load and 0.75 factor, the daily-balance threshold is 4 PSH because 240 ÷ (80 × 0.75) = 4. A different schedule or recovery target changes that threshold.
No. These are historical published examples used for an auditable comparison. Obtain project-specific solar data and the actual mounting and operating inputs.
It can add temporary reserve, but it does not create a daily charging surplus or establish recovery. Check storage and generation together.
Send Jieyao the site, lighting schedule and evidence requirements. Keep the proposed model connected to the calculation inputs and supporting records.
Request a configuration review →Contact Us
Get a custom lighting solution and quotation for your project. Yangzhou Jieyao Lighting Equipment Co., Ltd. manufactures outdoor lighting and steel poles in Guoji Town Industrial Park, Gaoyou City, Yangzhou, Jiangsu, China. The company reports a 10,000 m² factory site, more than 60 employees including more than 10 technical personnel, and more than 100 production and testing machines. The present company name dates from 2017; Jieyao Poles’ published history traces the team’s manufacturing lineage to 2006. The stated 15 years of experience refers to the team. The company reports exports to more than 60 countries. Do you have any questions or requests?
Email: jay@jieyaolighting.com

Click to Chat.
Im online now.
 English
 Español
 Bahasa Indonesia